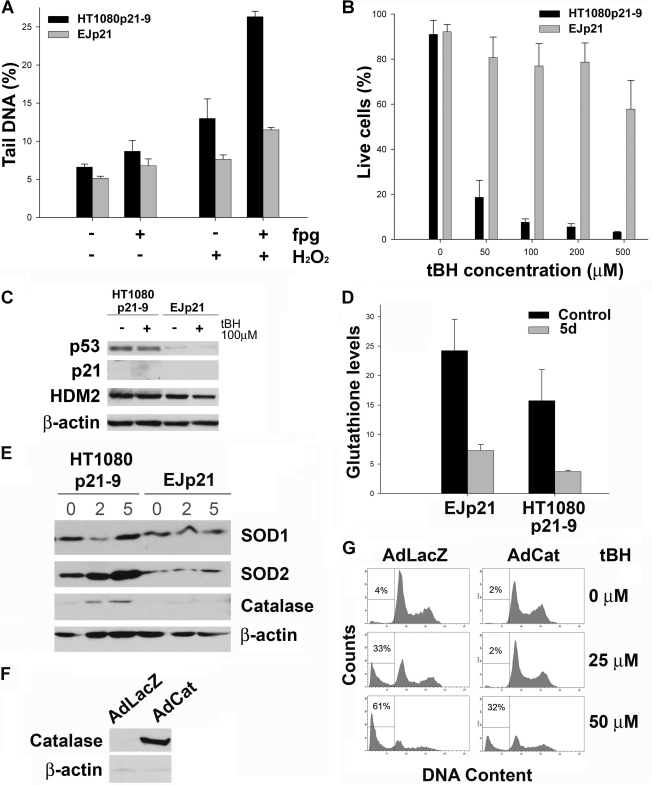
FIGURE 5.
Increased sensitivity to ROS in HT1080p21–9. A, comet assay of HT1080p21–9 and EJp21 cells treated or not with 100 μm H2O2 for 10 min on ice right before analysis. Experiments were performed in the absence or presence of fpg to determine specific damage due to oxidation (the difference in tail DNA percentage between the two conditions). Controls show results using fpg buffer. Mean percentage of tail DNA from three experiments is plotted. Error bars represent S.D. Experiments were performed twice in triplicate. B, annexin/PI-stained uninduced HT1080p21–9 (black bars) and EJp21 cells (gray bars), 24 h after exposure to different concentrations of tBH. Percentages of live cells are plotted. C, immunoblot analysis of uninduced HT10180p21–9 and EJp21 untreated (−) or 24 h after being treated with 100 μm tBH for 2 h and washed thereafter with PBS (+). D, intracellular levels of total glutathione in EJp21 and HT1080p21–9 cells, uninduced (Control) and after 5 days of p21 expression (5d). E, immunoblot analysis of HT10180p21–9 and EJp21 uninduced or after 2 or 5 days of p21 expression. F, immunoblot analysis of uninduced HT10180p21–9 cells infected for 24 h with adenovirus expressing LacZ (AdLacZ, control) or catalase (AdCat). G, representative plots of FACS analysis of PI-stained uninduced HT1080p21–9 infected for 24 h with AdLacZ or AdCat after being treated with 25 or 50 μm tBH as described. Percentages indicate amount of events in sub-G1 phase of the cell cycle.

