FIGURE 5.
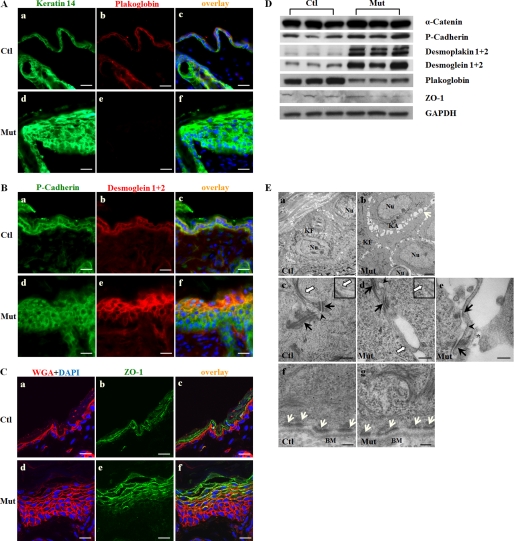
Assessment of cell-cell junction in Jup mutant epidermis. A, plakoglobin staining signal was lost in Jup mutant (Mut) keratinocytes (panel e) as opposed to membranous localization in control (Ctl) cells (panel b), whereas keratin 14 staining intensity was markedly increased in Jup mutant cells (panel d) compared with control cells (panel a). Panels c and f, overlay images. Scale bars = 30 μm. B, P-cadherin staining was similar between Jup mutant (panel d) and control (panel a) epidermis. Staining of desmogleins 1 and 2 was greatly increased in Jup mutant epidermis (panel e) compared with the control (panel b). Scale bars = 30 μm. C, the staining intensity of ZO-1 was similar between Jup mutant (panel e) and control (panel b) epidermis, although the signal was much expanded in Jup mutant epidermis. WGA, wheat germ agglutinin. Scale bars = 15 μm. D, Western blot analyses of cell junction proteins. E, ultrastructural analyses of Jup mutant epidermis. Loose cell-cell contacts between Jup mutant keratinocytes (panel b) are shown by segregated spaces (white arrows). Keratin fibers (KF) are at cell peripheries in both control (panel a) and Jup mutant (panel b) keratinocytes. Keratin aggregates (KA) are seen in the perinuclear (Nu) region of Jup mutant keratinocytes (panel b), but not in control cells (panel a). Desmosomes (black arrows) are anchored to the keratin plexus in control keratinocytes (panel c), whereas significantly fewer keratins are at Jup mutant desmosomes (panels d and e). The intercellular spaces of adherens junctions (arrowheads) are wider in Jup mutant keratinocytes (panels d and e) than in control keratinocytes (panel c). Tight junctions (white arrows) appear normal in Jup mutant keratinocytes (panel d). Tight junctions are also presented at higher magnification in the insets in panels c and d. Note that the partial cell membrane and associated cytoplasm (asterisk) are disintegrated from the Jup mutant keratinocyte cell body (panel e). In contrast, hemidesmosomes (white arrows) are intact in Jup mutant keratinocytes (panel g). BM, basal membranes. Scale bars = 2 μm (panels a and b), 250 nm (panels c–e), and 125 nm (panels f and g).

