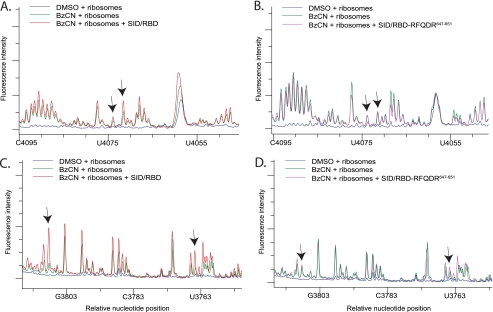
FIGURE 6.
SHAPE analysis of H89 and ES31 with the SBP2 SID/RBD domains. A and C, electrophoretic traces obtained from reactions containing ribosomes treated with DMSO (blue) or BzCN in the presence (red) or absence (green) of the SID and the RBD. cDNA fragments were generated from reactions using primer 4229 to cover H89 (A) and primer 3928 to cover ES31 (C). B and D, same as A and C except reactions were performed with the SID and the RBD 647RFQDR651 penta-alanine mutant (purple). Arrows in A, B and C, D indicate the same nucleotide positions displaying enhanced reactivity in the presence of CTSBP2 seen in Figs. 2B and 3A, respectively. Each trace is representative of three independent SHAPE experiments.

