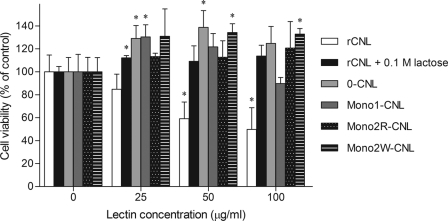
FIGURE 6.
Cytotoxicity of rCNL against Jurkat cells. Differently shaded bars represent viability of Jurkat human leukemic T cells treated with rCNL, rCNL preincubated with 0.1 m lactose, or with the mutants. Cell viability is represented as the percentage of control cell viability devoid of the lectins, taken as 100%. Data are means with error bars indicating standard deviations of triplicate experiments. Statistically significant differences (p < 0.05) between treated groups compared with the untreated are indicated by an asterisk above bars.

