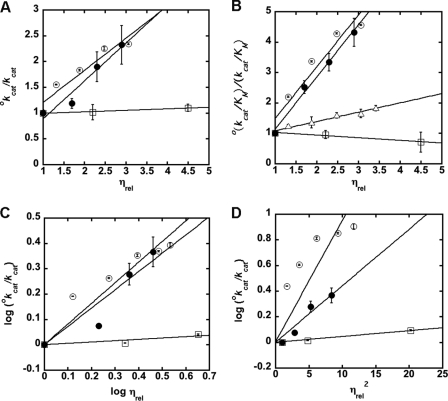
FIGURE 2.
A and B, effect of solvent viscosity on kcat (A) and kcat/Km (B). The effects of the microviscogens sucrose (0–35% (w/v)) and glycerol (0–35% (w/v)) on WT MshB are depicted as open and filled circles, respectively, whereas the macroviscogen Ficoll 400 (0–10% (w/v)) is denoted as open squares. Data for the Y142F mutant in the presence of sucrose is depicted by open triangles. Plots C and D are used to determine if there is a conformational change associated with product release and/or substrate binding. Apo-MshB was incubated with stoichiometric Zn2+. After 30 min, the enzyme was diluted into assay buffer (50 mm HEPES, 1 mm TECP, 50 mm NaCl, pH 7.5) containing substrate, and the initial rates for the deacetylation of a subsaturating (5 mm) or saturating (100 mm) concentration of GlcNAc were measured as described under “Materials and Methods.” The slopes are provided in supplemental Table S1.

