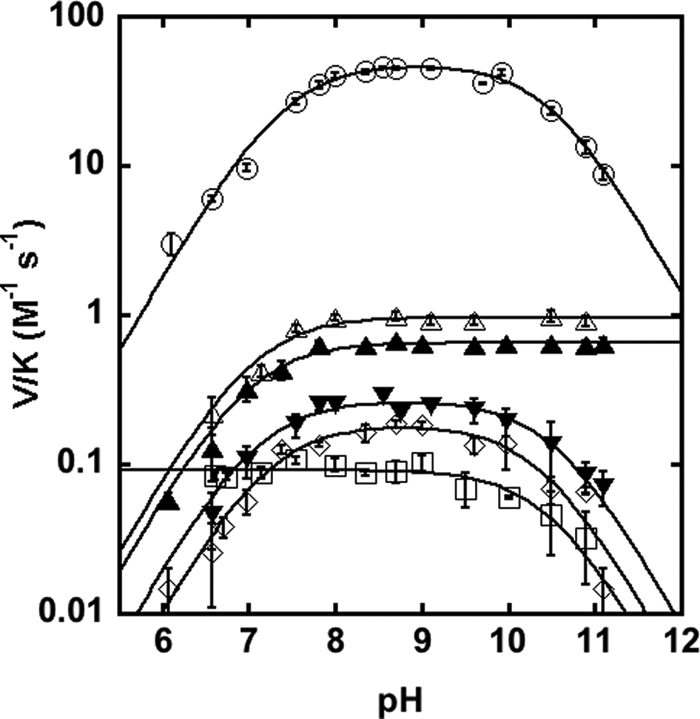
FIGURE 4.

pH rate profiles. Shown is the effect of pH on the deacetylation of GlcNAc by MshB under subsaturating substrate concentrations (V/K). The pH dependence of the MshB-catalyzed reaction is shown for WT (○), D15A (□), Y142A (△), Y142F (▴), H144A (▾), and D146A (♢). Assays were measured at 30 °C with subsaturating (5–50 mm) concentrations of GlcNAc as described under “Materials and Methods.” The pKa values were determined by fitting the equation including two ionizations (Equation 1) or one ionization (Equation 2 or 3) and are shown in Table 3.
