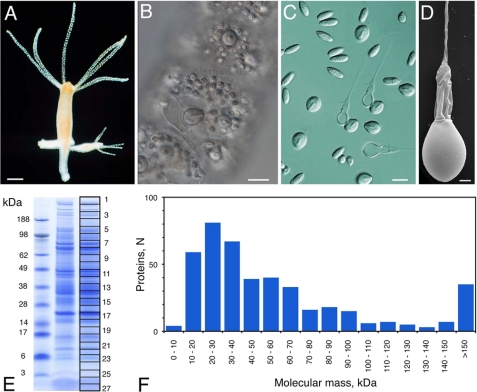
FIGURE 1.
Nematocyst morphology and protein spectrum. A, H. magnipapillata. B, close-up of undischarged nematocysts assembled in battery cells of the tentacles. C, light microscopic view of isolated nematocyst capsules. D, scanning electron microscopic image of isolated nematocyst. E, one-dimensional SDS-PAGE of a nematocyst sample. The gel slices used for mass spectrometry are indicated. F, molecular mass distribution of the nematocyst proteome. Scale bars = 0.5 mm (A), 15 μm (B and C), and 2 μm (D).

