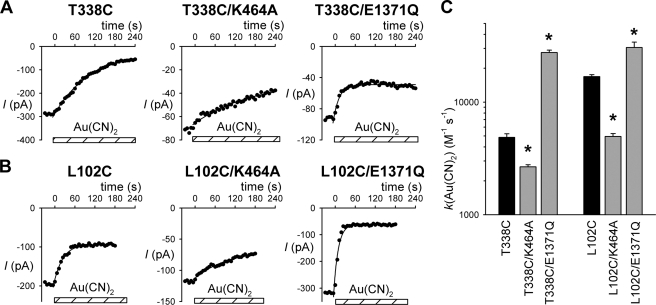
FIGURE 2.
Rate of modification by internal Au(CN)2−. A and B, sample time courses of macroscopic currents carried by different CFTR channel variants as indicated in inside-out membrane patches. In each panel, 2 μm Au(CN)2− was applied to the cytoplasmic face of the patch at time zero as indicated by the hatched bars. The decline in current amplitude following Au(CN)2− application has been fitted by a single exponential function. C, average modification rate constants (k) for Au(CN)2−, calculated from fits to data such as those shown in A and B. Asterisks indicate a significant difference from the cysteine mutants T338C and L102C (black bars) (p < 0.02). Data are mean from three or four patches.

