FIGURE 1.
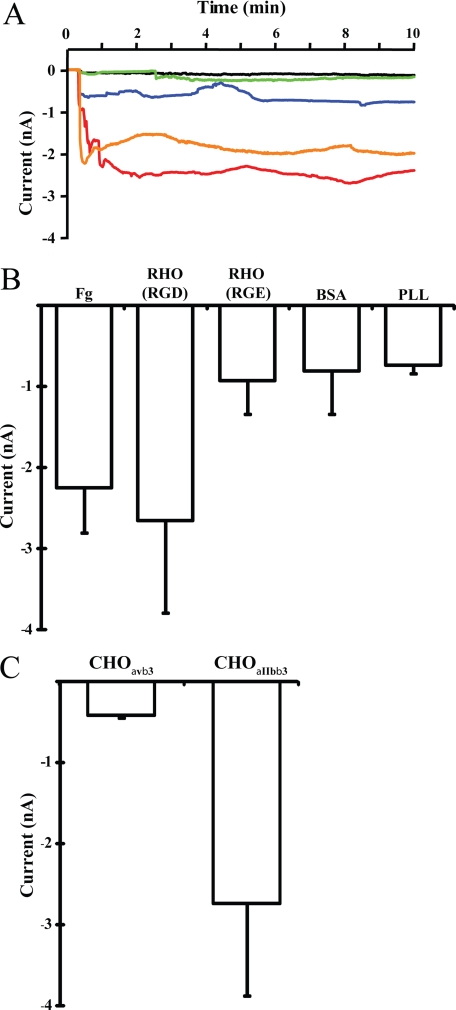
Detection of integrinαIIbβ3-mediated membrane permeability changes by the whole cell voltage-clamp technique. A, CHOαIIbβ3 cells were attached onto different substrates and membrane permeability changes monitored by whole cell voltage-clamp recording. The current change of cells attached onto various substrates are shown as different color traces: CHOαIIbβ3 cell onto fibrinogen (Fg), orange trace; rhodostomin (RGD) (RHO (RGD), wild type), red trace; rhodostomin (RGE) (RHO (RGE), mutant), blue trace; BSA, green trace; poly-l-lysine (PLL), black trace. B, summary of membrane permeability changes data from three independent experiments as shown in panel A. Note that integrinαIIbβ3 specific substrates fibrinogen and rhodostomin (RGD) induce membrane permeability changes. The numbers (n) of cells recorded for each substrate were: fibrinogen, n = 6; rhodostomin (RGD), n = 12; rhodostomin (RGE), n = 4; BSA, n = 13; poly-l-lysine, n = 3. C, CHOαvβ3 and CHOαIIbβ3 cells were attached onto the rhodostomin (RGD) substrate and the membrane permeability monitored using whole cell voltage-clamp recording. Note that rhodostomin (RGD) induced membrane permeability changes were observed in CHO cells expressing integrinαIIbβ3 but not integrinαvβ3. The numbers (n) of cells recorded for each cell line were: CHOαvβ3, n = 4; CHOαIIbβ3, n = 7. Error bars indicate S.E.

