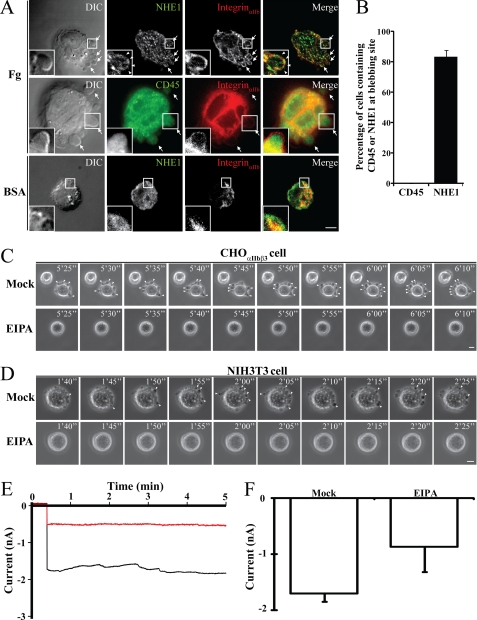
FIGURE 3.
Analyses of NHE1 distribution in bleb membranes and the role of NHE1 in membrane blebbing and permeability changes. A, CHOαIIbβ3 cells, plated onto fibrinogen or BSA substrates, were stained with fluorescent-tagged immunoglobulins to highlight NHE1, integrinαIIb, and CD45 distributions. Cell images were recorded under a DIC microscope (left panel) and fluorescence microscope (three right panels). Membrane blebs were observed when CHOαIIbβ3 cells were plated onto fibrinogen substrate (first and second rows, arrows) but not on BSA substrate (third row). The merged images show co-localization of integrinαIIb and NHE1 (right panel). Note that NHE1 (insets of the first row, arrowheads), but not CD45 (insets of the second row), is located in the bleb membrane when plated onto fibrinogen substrate. The insets in each panel are enlarged from the portion of the cell indicated by a square box. B, percentage of cells with bleb-associated NHE1 (n = 51 cells) or CD45 (n = 49 cells) from three independent experiments such as those in A are shown. Note that NHE1, but not CD45, was present in the bleb membrane when CHOαIIbβ3 cells were seeded onto the fibrinogen substrate. C, CHOαIIbβ3 or (D) NIH3T3 cells pretreated with or without NHE1 inhibitor (EIPA) were seeded onto fibrinogen or fibronectin substrates. Time-lapse phase-contrast microscopy images were taken at 5-s intervals. The scale bars in panels A, C, and D represent 5 μm. Note that bleb growth was induced by fibrinogen or fibronectin substrates (upper panels, arrowheads) but was inhibited by EIPA pretreatment (lower panels). Numbers on panels C and D indicate time in min. E, membrane permeability changes of CHOαIIbβ3 cells attached onto a rhodostomin (RGD) substrate in the presence (red trace) or in the absence (black trace) of EIPA. Membrane permeability changes were measured by whole cell voltage-clamp recording. F, summary of membrane permeability change data from three independent experiments as shown in panel E. The numbers (n) of cells recorded for each treatment were: mock, n = 6; EIPA, n = 5. Error bars indicate S.E.

