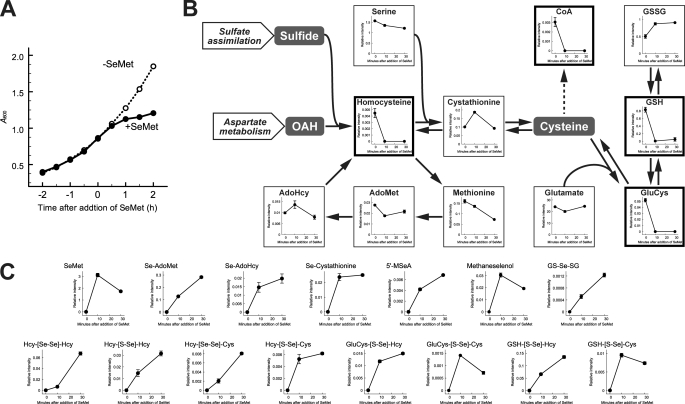
FIGURE 1.
Metabolic profile of SeMet-treated yeast. A, S. cerevisiae W303-1A strain was grown in SC-Met liquid medium at 30 °C until mid-log phase, and then SeMet was added (final concentration, 0.25 mm). The A600 values of the cultures with (solid line) or without (dashed line) SeMet were plotted. B, metabolites extracted from SeMet-treated cells were analyzed using CE-TOFMS. Time-dependent changes in metabolite pools are mapped on the sulfur metabolic pathway. Metabolites whose levels changed significantly (p < 0.05) are indicated in bold frames. C, selenium compounds assigned based on their m/z values and isotopic patters are shown. These graphs are representative results of the assigned peaks (see also supplemental Table S3). The mean values of the relative intensity obtained from three independent experiments were plotted, and the vertical bars indicate S.E. (B and C).

