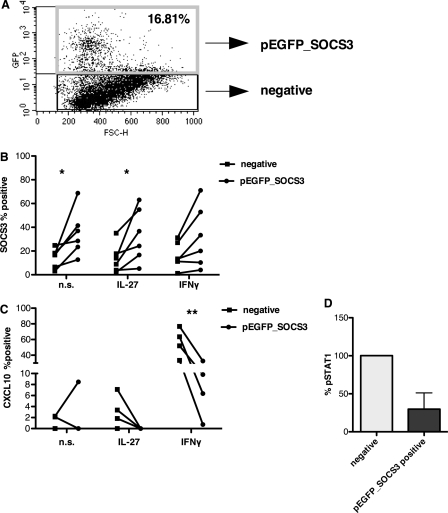
FIGURE 5.
Overexpression of eGFP-SOCS3 in keratinocytes results in a decrease of STAT1 activation and CXCL10 production. A–C, eGFP-SOCS3-transfected cells were analyzed by FACS. eGFP-positive cells were considered as successfully transfected (pEGFP_SOCS3-positive) (A). This population was gated and compared with the eGFP-negative cells for the expression of SOCS3 (B) and CXCL10 (C) (50 ng of IL-27, 20 ng of IFNγ; n = 6). *, p < 0.05; **, p < 0.02. D, eGFP-positive or -negative fractions were sorted by FACS. Protein extracts were taken from both sorted fractions and analyzed for their amount of activated STAT1 by ELISA (50 ng/ml IL-27, 15 min).

