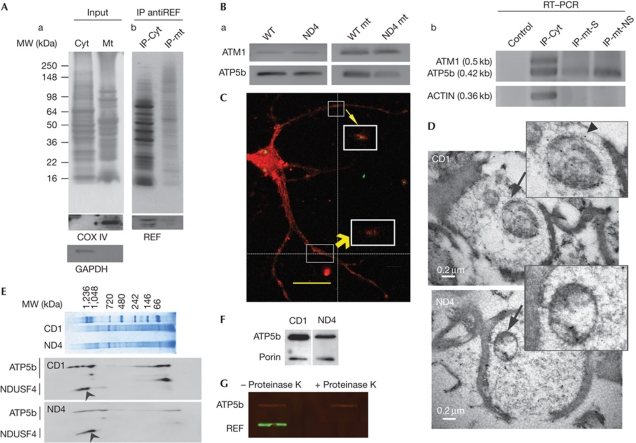
Figure 1.
REF and ATP5b status on mitochondrial fraction. (A) Demonstration of RNA binding export factor (REF) in mitochondrial fraction. AntiREF immunoprecipitation (IP) from cytosolic or mitochondrial fraction. (a) The input retinal cytosolic and brain mitochondrial protein extracts were separated on a 10% SDS–PAGE and detected with antiCOX IV and glyceraldehyde-3-phosphate dehydrogenase (GAPDH) as indicated. (b) IP products from inputs as shown in panel a were gel fractionated and visualized using silver staining. Bottom panel shows recovery of REF using western analysis. (B) Detection of ATP5b and ATM1 mRNA by reverse transcription–polymerase chain reaction (RT–PCR). (a) ATM1 and ATP5b with wild-type (WT) and ND4 mitochondrial (mt) fraction. (b) Detection of ATP5b, ATM and actin in normal mouse complementary DNA derived from three IP products: Retinal cytosolic (cyt), non-synaptic (mt-NS) and synaptic (mt-S) mitochondria as indicated were carried out using appropriate primer pairs. Control represents RT–PCR from an IP performed with an antibody unrelated to any known mammalian protein. Bottom panel shows amplification of actin used as a control. The product size has been provided in the parentheses. (C) Localization of REF on the mitochondrial surface. Primary hippocampal neuron culture was probed with Porin (red) and REF (green) antibodies. Merged figure has been shown. White boxes indicated co-localization of REF and Porin. Z axis and magnified view indicated by yellow arrows. Scale bar, 20 μm. (D) Electron microscopy in detection of REF at mitochondrial surface. Upper and lower panel indicate CD1 and ND4 mice sections, respectively. Scale bar, 0.2 μm. Arrow and arrowhead indicate the region shown in the inset and a mitochondrial gold particle, respectively. (E) Blue native gel electrophoresis of mitochondrial protein extract from CD1 and ND4 mice as indicated (upper panel). Bottom panel shows western blot analyses from a posttransfer two-dimensional SDS–PAGE. Arrowhead indicate NADH dehydrogenase ubiquinone iron-sulphur protein 4 (NDUSF4); proteins were probed with antibodies as indicated. (F) Western blot analyses of mt proteins from CD1 and ND4 mice with ATP5b and Porin as indicated. (G) Control and mt subjected to digestion with Proteinase K as indicated probed for REF and ATP5b, with secondary antibodies coupled with IR-700, IR-800 and scanned on an Odyssey infrared imaging system (Li-Cor Biosciences, Lincoln, NE). MW, molecular weight.

