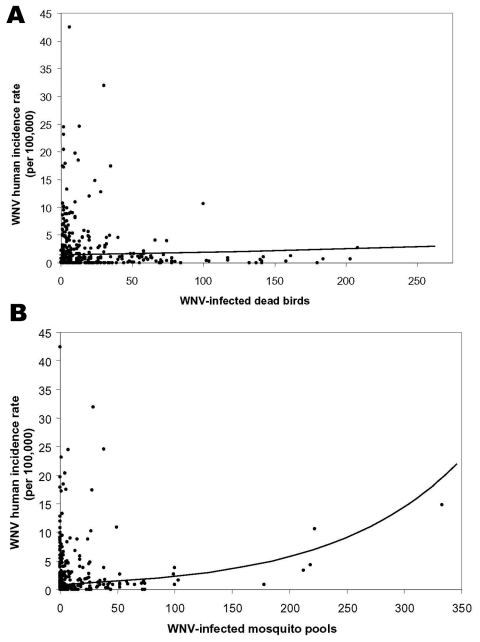
Figure 2.
Plots of West Nile virus (WNV) incidence by collections of virus-positive dead birds (A) and virus-positive mosquito pools (B). Log linear models fit to both surveillance systems considered alone are displayed. WNV-infected dead birds explain 2.5% of the variation in human incidence (A), whereas WNV-infected mosquito pools explain 38% (B).

