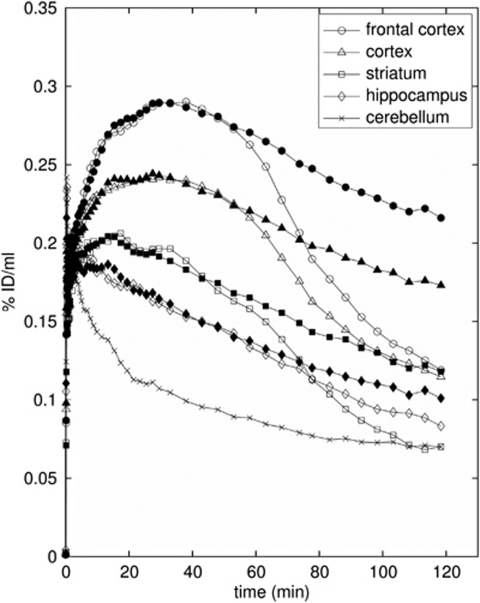
Figure 2.
Average regional time–activity curves (n=2 rats) for displacement studies with ketanserin injected (1.5 mg/kg) at 60 minutes (hollow symbols). The solid symbols were produced by fitting the simplified reference tissue model up to 60 minutes, then extrapolating the model fit from 60 to 120 minutes to give an estimate of the time–activity curves without ketanserin displacement.

