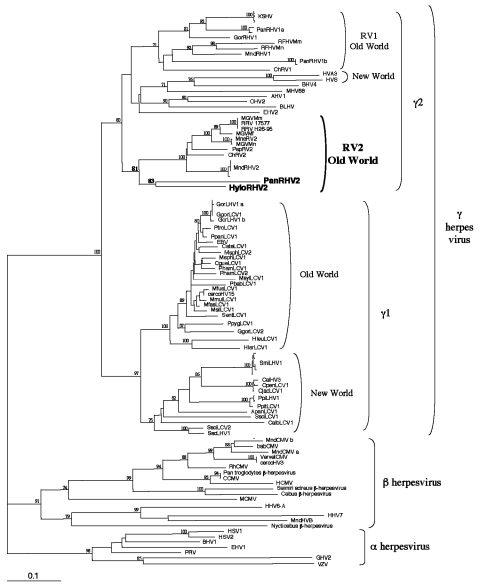
Figure 2.
Phylogenetic tree resulting from analysis of selected 351-bp fragments of herpesvirus DNA polymerase gene, which is available for all viruses. The DNA sequences were first aligned by using ClustalX (nonphylogeneticaly informative gaps were manually removed), then the phylogeny was derived by the neighbor-joining method applied to pairwise sequence distances calculated by the Kimura two-parameter method (transition-to-transversion ratio set at 1.15 as expected by a previous Maximum Likelihood analysis). Horizontal branch lengths are drawn to scale, with the bar indicating 0.1 nucleotide replacements per site. Numbers at each node indicate the percentage of bootstrap samples (of 1,000) in which the cluster to the right is supported. Brackets on the right indicate previously defined subfamily and genus herpesviral classification. Previously published sequences and their accession numbers are described online at: http://www.cdc.gov/ncidod/EID/vol10no5/03-0964-G2.htm

