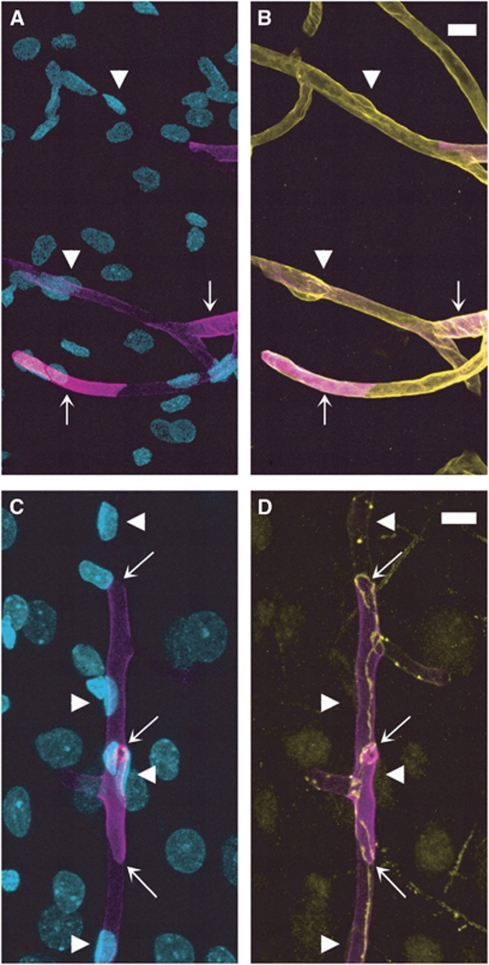
Figure 6.
Endothelial barrier antigen (EBA) expression shows a high cell-to-cell heterogeneity in cortical capillaries. (Upper panels) EBA/nuclei (A) and EBA/laminin (B) overlays after EBA (magenta)/laminin (yellow)/nuclei (cyan) triple staining. Some vascular segments show a high (arrows) and others much lower (arrowheads) expression level of EBA. (Lower panels) EBA/nuclei (C) and EBA/occludin (D) overlays after EBA (magenta)/occludin (yellow)/nuclei (cyan) triple staining. Four endothelial cells are readily distinguished (arrowheads). The transition from high to low level of EBA can be seen at intercellular borders (arrows). Bar: 10 μm

