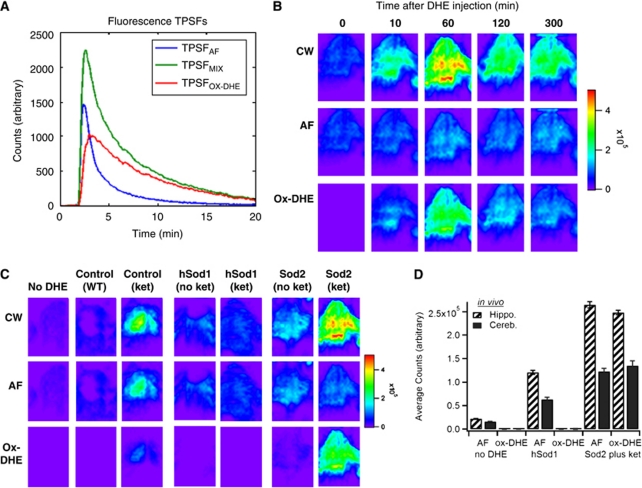
Figure 2.
Characterization of the kinetics and superoxide dependence of in vivo dihydroethidium (DHE) oxidation and application of time-domain unmixing. (A) Fluorescence temporal point spread functions (TPSFs) for TPSFAF (blue, from No-DHE image, C), TPSFmix (green, from Figure 1D), and TPSFox-DHE calculated (red) graphed as fluorescence intensity (counts) versus time. (B) In vivo time series (in minutes) imaging of a Sod2+/− mouse with ketamine-induce Nox2-dependent superoxide (see Materials and methods for details) before and after DHE injection, with integrated continuous wave (CW) fluorescence intensity images (top row), corresponding lifetime-unmixed autofluorescence (AF; middle row), and oxidized DHE (ox-DHE) images (bottom row). The Sod2+/− (plus ketamine) mouse exhibited a significant increase in ox-DHE fluorescence even 10 minutes after injection, which was further increased at 1 hour, and decreased to a relatively stable signal at ∼2 hours after injection. The linear pseudocolor intensity scale is at the right. (C) Images at 60 minutes after DHE injection (except for the No-DHE control) of aged-matched mice under the following conditions: wild-type (WT) control, WT injected with ketamine to induce Nox2, hSOD1cje3 transgenic mouse with overexpression of superoxide dismutase-1, hSOD1cje3 mouse injected with ketamine, Sod2+/− mouse with partial deficiency in superoxide dismutase-2, and Sod2+/− mouse injected with ketamine. The integrated (CW) fluorescence (top), lifetime-unmixed AF image (middle), and ox-DHE images (bottom) are shown for each. (D) Graph of in vivo AF and ox-DHE fluorescence in the hippocampal and cerebellar regions for the No-DHE control, the hSODcje3+/− mouse, and the ketamine-injected Sod2+/− mouse.

