Figure 3.
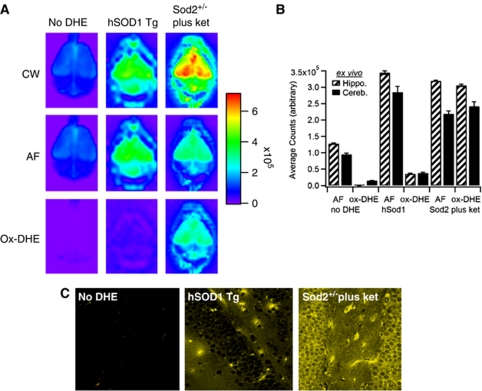
Comparison of in vivo fluorescence with ex vivo brain and confocal slice imaging of oxidized dihydroethidium (ox-DHE). (A) Optix images of ex vivo brains from the No-DHE, hSODcje3+/−, and Sod2+/− (plus ketamine) mice from Figure 2. The continuous wave (CW) fluorescence intensity images (top row), corresponding lifetime-unmixed autofluorescence (AF; middle row), and resulting ox-DHE images (bottom row) are shown. The linear pseudocolor intensity scale is at the right. (B) Graph of ex vivo AF and ox-DHE levels in designated brain regions. (C) Fixed slices prepared post-mortem after ex vivo imaging from these brains, imaged using a multiphoton confocal microscope (Karl Zeiss) with 488 nm excitation (Ex) λ, and >590 nm emission (Em) filter. For the confocal images, ox-DHE fluorescence is shown in gold.

