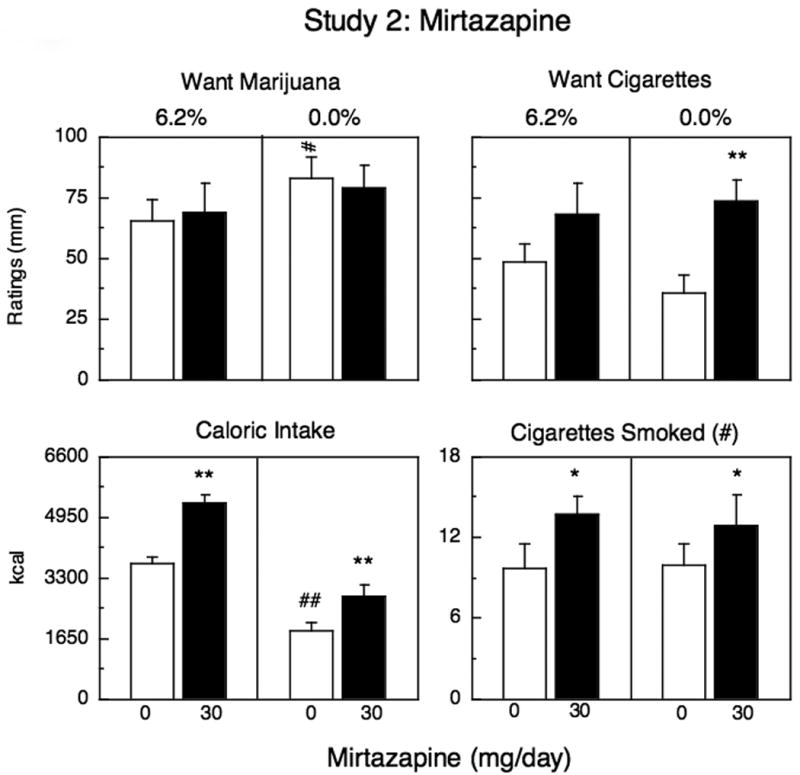
Figure 2.

Mean peak effects (top panels) and mean effects (bottom panels) during marijuana administration (6.2%) and during marijuana abstinence as a function of mirtazapine dose. Each graph represents 11 participants except for the two panels on the right, which only represent the 7 participants who smoked at least 5 cigarettes/day. See Figure 1 for details.
