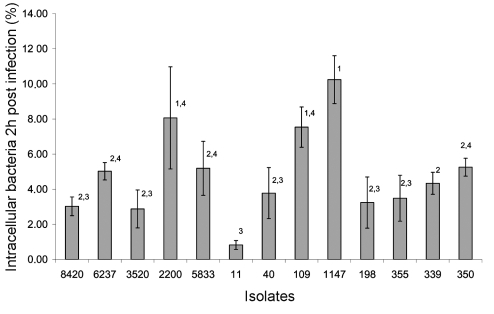
Figure 2.
Invasion of Salmonella strains in the human intestinal epithelial cell line T84. The y-axis shows the percentages of intracellular bacteria 2 hours postinfection, relative to the initial number of bacteria, incubated with the cells. The x-axis shows isolate numbers. All isolates derived from the group-housed cats had the same invasion percentage as strains 198 and 355 (data not shown). Isolates 55 and 1145 had the same invasion percentage as strain 1147 (data not shown). Data not sharing superscript numbers indicate statistically significant differences (p < 0.05).

