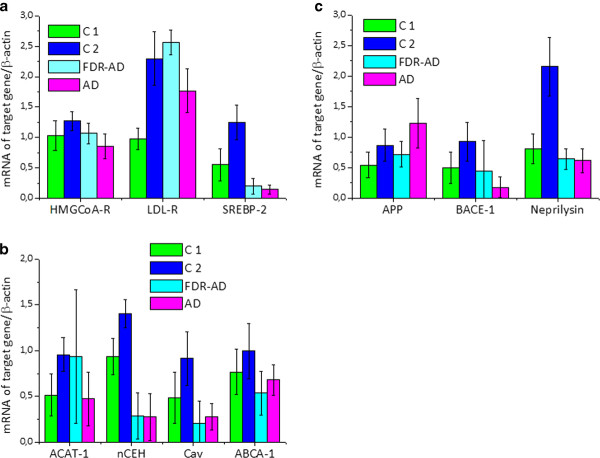
Figure 3.
Densitometric analysis of mRNA levels of target genes normalized for the endogenous β-actin. mRNA levels were quantified by using NIH Image 1.63 program (Scion Image). Data values are represented as mean ± SD for each group. *Statistical analysis performed by using the one-way ANOVA test showed highly significant differences among the groups (P = 0.000 for all genes, with the exception of ACAT-1 for whom the significance was P = 0.006).

