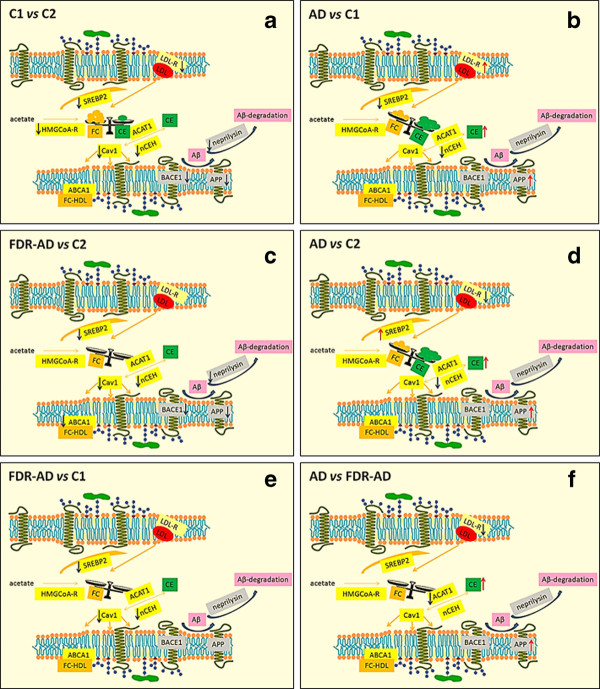
Figure 4.
Schematic representation of the data collected from the mRNA quantifications. The schemes represent the expression level, cellular compartment and metabolic network position of genes linked to cholesterol homeostasis and to APP processing. The arrows (↑↓) denote the significant (P < 0.05) differences (increase or decrease, respectively) between the two indicated groups, obtained by applying a Bonferroni's multiple comparison test following ANOVA.

