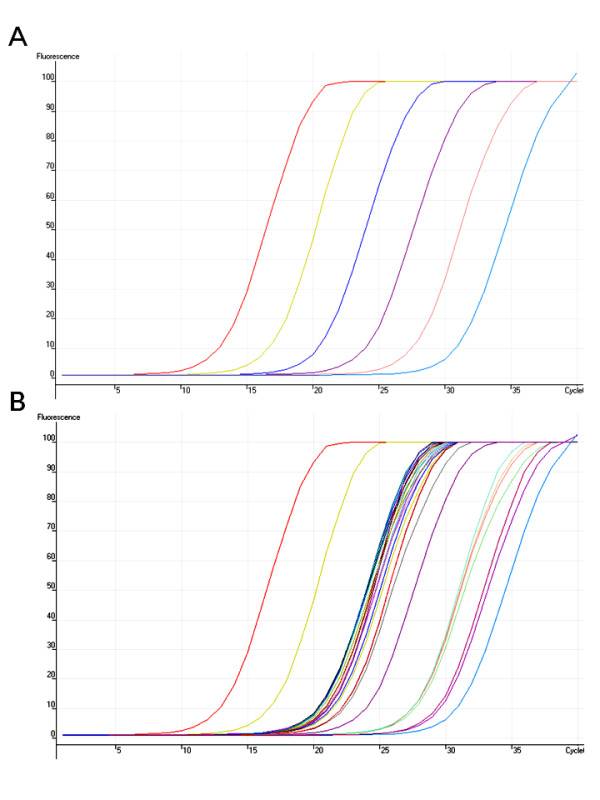
Figure 2.

Amplifications of bH2c transcript in floral samples. Petals of the common morning glory were taken 12 hours before floral opening on five consecutive days (n = 5) on the same plant (III6D). Each sample was represented by three repeats in the same qPCR run. (A) The target standard curve; (B) The unknown samples amplified along with the standard in the same run. The fluorescent level of SYBR Green I was measured at 510 nm.
