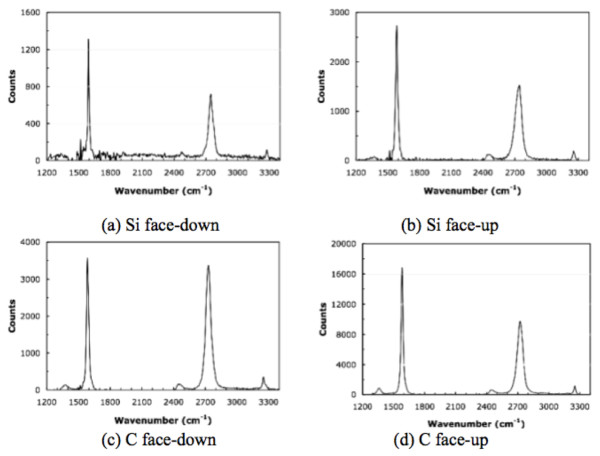
Figure 3.
Raman spectra for the various orientations of the SiC faces. The Raman spectra for the various orientations of the SiC faces were measured for samples grown at the same time under the same temperature conditions. The underlying spectra for the SiC substrate measured at the same time have been subtracted to produce the graphene results. These samples were grown at the same time in the same carrier at 1,450°C for 60 min. The Si-face-up (b) and C-face-down (c) spectra are from the two sides of one wafer piece, while the corresponding Si-face-down (a) and and C-face-up (d) spectra are from a second wafer piece.

