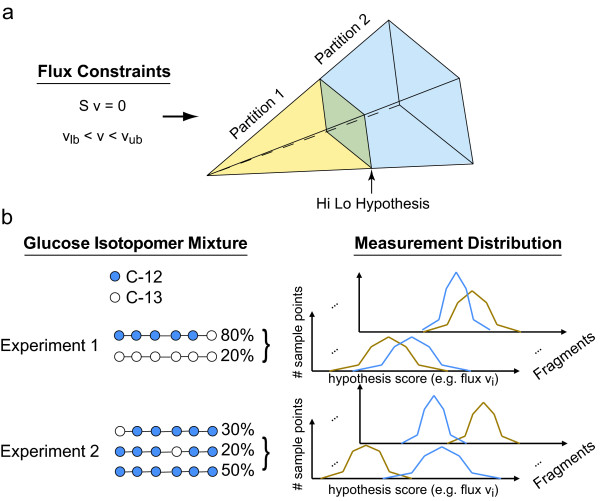
Figure 2.
Method Overview. a) The space of flux distributions is partitioned in two parts corresponding to 'high' flux versus 'low' flux. A uniform random sample is drawn from the space and is also partitioned into partition 1 and partition 2. b) For each point in the space the distribution of experimental measurements is simulated. Hypothetical experiment 1 and experiment 2 with different glucose label mixtures produce different measurement distributions. The distributions from experiment 2 are more separated, indicating parameters of experiment 2 are more conducive for differentiating between the high and low partition.

