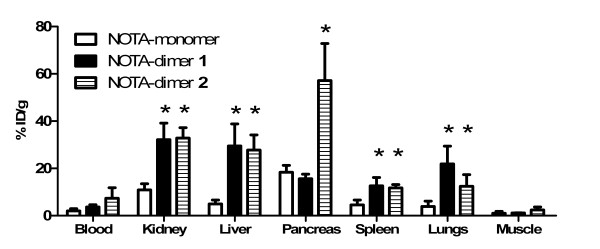
Figure 6.
Biodistributions of 64Cu-labeled NOTA-monomer, NOTA-dimer 1 and NOTA-dimer 2. Biodistributions are at 0.5 h post-injection in Balb/c female mice (four mice/group). Results are presented as mean %ID/g ± SD. The p value refers to the difference between NOTA-dimer 1 (black filled square) and NOTA-monomer (empty square) or NOTA-dimer 2 (stripped filled square) and NOTA-monomer. Asterisk, p < 0.05.

