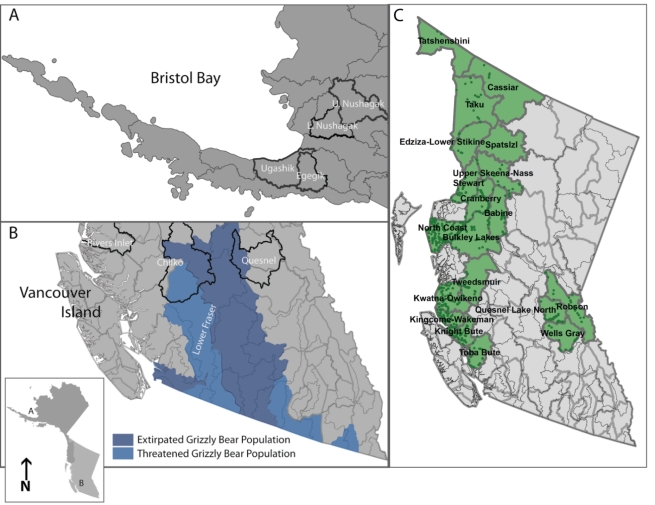
Figure 2. Salmon stocks and grizzly bear population units (GBPUs) used in our analyses.
We consider three sockeye salmon stocks from (A) Bristol Bay, Alaska, and (B) two stocks from the Fraser River, British Columbia (BC), Canada, and one from the mid-coast of BC (Rivers Inlet). Watersheds are outlined by thin gray lines and focal watersheds are outlined in black. In BC, thick gray lines denote designated GBPUs from which isotope data were derived. The Chilko and Quesnel stocks are in a region of bear conservation concern. (C) Percent salmon in grizzly bear diet as a function of salmon availability across 18 GBPUs in BC. Stable isotope data were collected from 1995 to 2003 in green-filled GBPUs. We first allocated mean salmon biomass measured at points from 1995 to 2003 to watersheds (thin lines). We then allocated salmon biomass to grizzly GBPUs (thick lines) based on the area of intersection between watersheds and GBPUs.

