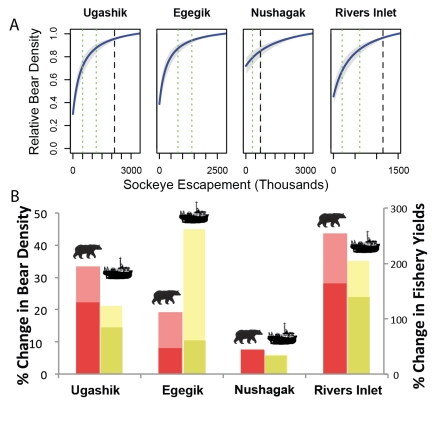
Figure 4. Accounting for bears when setting escapement goals in Bristol Bay and Rivers Inlet.
(A) Bear density as a function of sockeye salmon escapement relative to the expected bear density at the maximum observed escapement (solid blue line). Vertical black dashed lines indicate EMSY. The lower and upper escapement goals are highlighted by green dotted lines. (B) Increasing escapements from the lower to upper goals can substantially increase bear density (lower dark-red bar). Further increases in escapement to EMSY continue to increase bear density (upper light-red bar), but the benefit is somewhat less due to the saturating relationship between escapement and percent salmon in diet. Importantly, there is no expected tradeoff to increasing escapement; yields are expected to be higher at upper escapement goals (lower dark-yellow bar) and increase further until EMSY (upper light-yellow bar). Although EMSY and the response in fisheries yields are uncertain, especially for the Egegik stock, bear success can still be assessed at the tangible lower and upper escapement goals and beyond.

