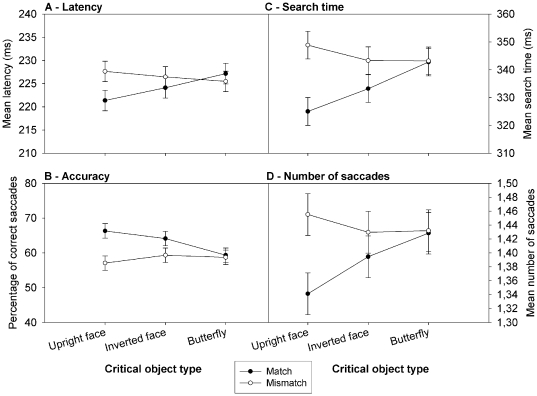
Figure 3. Oculomotor guidance and interference by the different Critical objects.
Results of the search task in terms of mean latency (A), mean accuracy (B), mean search time (C) and mean number of saccades to reach the target (D), as a function of the critical object type included in the display and as a function of the location of the critical object matching or not that of the target. Error bars represent CI.

