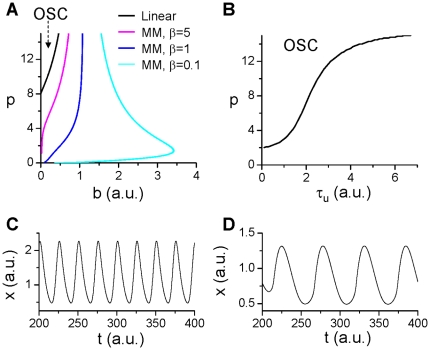
Figure 6. Effects of protein degradation kinetics on oscillations in negative feedback mediated oscillations.
A. The oscillation region (marked by “OSC") under different degradation kinetic conditions. The OSC regions were obtained using the constraint of Eq.1 or Eq.2. Specifically, we first use the linear kinetics  (and
(and  ,
,  ) to determine the OSC region and the steady state ξ in the b-p space. We then use the MM kinetics
  (and
(and  ,
,  ) and use Eq.2 (k
d=b) and b and ξ from the case of linear kinetics to determine α for different β, i.e.,
  . By applying this constraint, we map the OSC regions of the MM kinetics to the b-p space of the case of linear kinetics so that we can compare their effects on stability fairly. B. The OSC region in τ
u-p space for β=1, b=0.5). C. x versus time for linear degradation kinetics with p=12 and b=0.15. D. x versus time for MM kinetics with p=0.1, β=0.1, and b=0.5.

