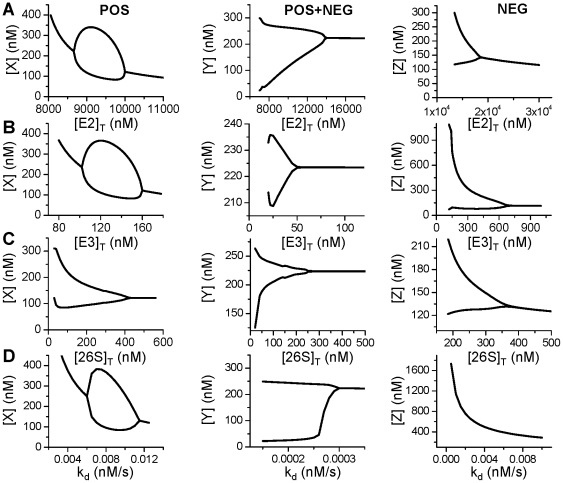
Figure 7. Effects of the UPS proteins on oscillations.
A. Bifurcation diagrams showing the effects of E2 on oscillations from the three different mechanisms. Plotted are maximum and minimum values of a substrate protein versus [E2]T. B. Same as A but for E3. C. Same as A but for 26S. D. Same as A but for linear degradation kinetics.

