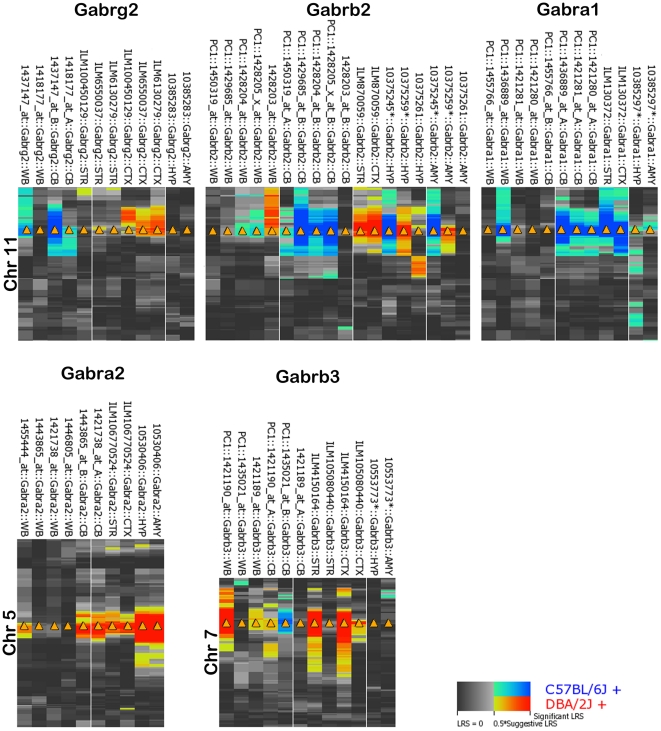
Figure 2. Consistency of cis modulation across tissues.
Genetic regulation of the 5 subunits regulated by strong cis eQTLs in the hippocampus was compared across three different platforms Affymetrix M430 (WB = whole brain, CB = cerebellum), Affymetrix MoGene 1.0 ST (AMY = amgydala and HYP = hypothalamus), and Illumina (CTX = neocortex, STR = striatum). Each probe set was required to have a mean expression of at least 8 in each tissue database. Blue and red indicate an association between the B6 and D2 allele at each locus and higher probe set expression, respectively. The more intense hue indicates a greater association and a corresponding increase in significance. For all data except the HYP and AMY, probes overlapping SNPs were filtered out and a principal component analysis was performed on remaining probes to capture a component (PC1) explaining the majority of the variation in probe set expression. Percent of variance explained by each PC1 ranged from (∼45% to 95%). Because of the large number of probes included for measurement in the HYP and AMY, a probe level analysis was not possible. Some probe sets (indicated by *) contained 1 to 3 probes overlapping a variant. It is hard to predict the overall effect of these variants but, in general, those probe sets with SNPs that have higher expression associated with the B6 allele (blue) have a higher chance of being false due to SNP artifacts. Cis modulation of expression across tissues is most consistent for Gabra2 and Gabra1.

