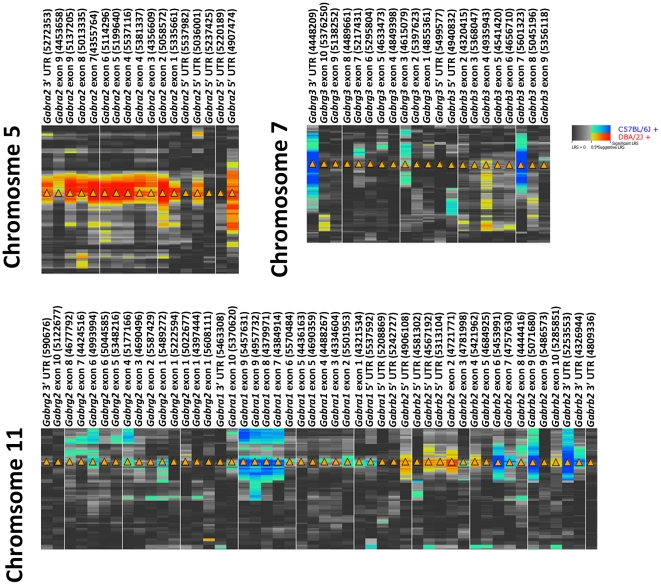
Figure 3. Summary of genetic regulation of GABA(A) R subunits across transcript features.
Genetic regulation of exon, intron, and 3′ UTR features for each of the five subunits regulated by strong cis eQTLs was measured in the hippocampus using the Affymetrix exon platform (database accession number GN206). Each probe set was required to have a mean expression of at least 10 and all probe sets overlapping SNPs were excluded. Blue and red indicate an association between the B6 and D2 allele at each locus and higher probe set expression, respectively. The more intense hue indicates a greater association and a corresponding increase in significance. Only Gabra2 shows strong consistency of genetic regulation across mRNA regions.

