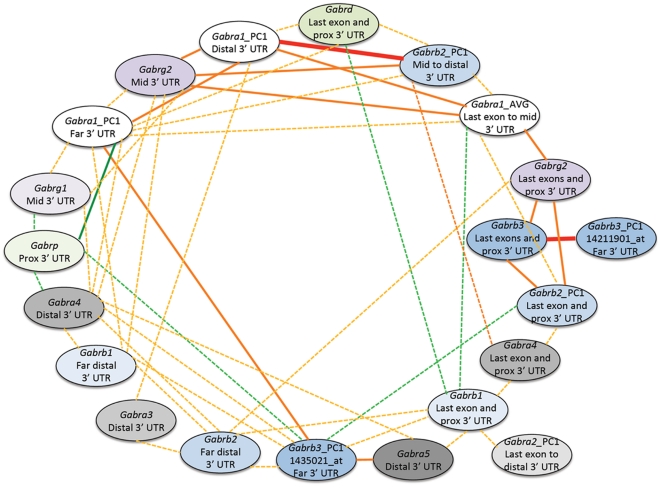
Figure 4. Coexpression of GABA(A) Receptor subunits in the hippocampus.
Bold lines indicate a correlation between 1 and 0.7 while normal and dashed lines indicate a correlation between 0.7 and 0.5 and 0.5 and 0.3, respectively. Warm colors represent positive correlations while cool colors represent negative correlations. Probes containing SNPs were removed and a principal component analysis (PCA) was used on the remaining probes to capture the component explaining the majority of the expression variation (PC1) in probe expression among BXD strains. PCA was used to extract PC1 for a single subunit when more than two probe sets were strongly correlated (r>0.8) and the average (AVG) was used when two probe sets were strongly correlated. prox = proximal, mid = middle. The highest positive correlations are between subunits targeting the same mRNA region. This is especially true for members of the most common heterotrimeric receptor—Gabra1, Gabrb2, and Gabrg2.

