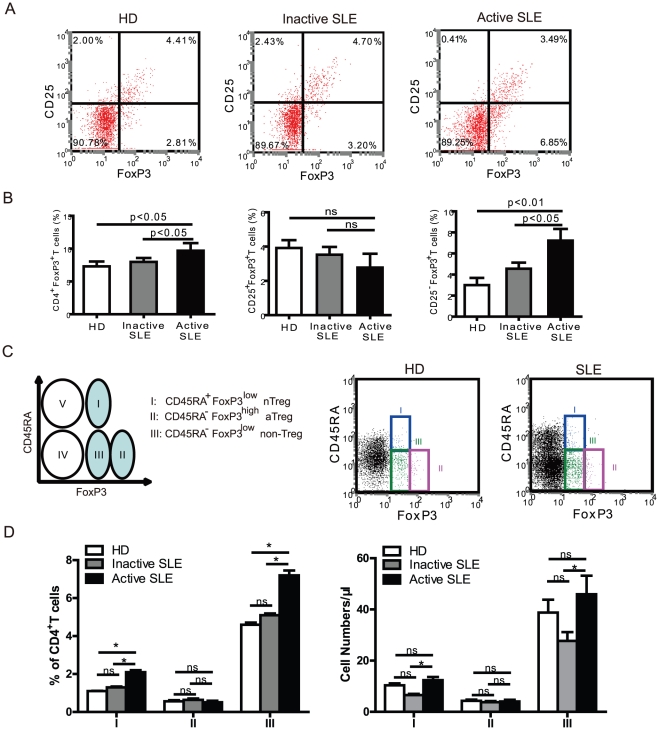
Figure 1. Phenotypic characterization of CD4+FoxP3+ T subset cells in patients with systemic lupus erythematosus (SLE).
(A) PBMCs were gated on CD4+ T cells and analyzed for CD25 and FoxP3 expression by FCM. Data are representative of 5 independent experiments from healthy donors, and patients with inactive and active SLE. (B) Percentages of CD4+FoxP3+ T cells, CD4+CD25−FoxP3+ T cells and CD4+CD25+FoxP3+ T cells among CD4+ T cells in healthy donors (n=15), inactive SLE (n=26) and active SLE patients (n=15). Data represent the mean ± SEM. ns, means no significant differences. (C) Five subsets of CD4+ T cells are defined by the expression of CD45RA and FoxP3: CD45RA+FoxP3low cells (I); CD45RA−FoxP3high cells (II); CD45RA−FoxP3low cells (III); CD45RA−FoxP3− cells (IV); CD45RA+FoxP3− (V) cells. Representative dot plots are shown for a healthy donor and an active SLE patient. (D) The percentages and absolute numbers of different CD4+ T cell fractions I, II, and III were analyzed in healthy donors (n=15), inactive SLE (n=26) and active SLE patients (n=15). Data represent mean ± SEM. ns, means no significant differences. *, mean p<0.05.

