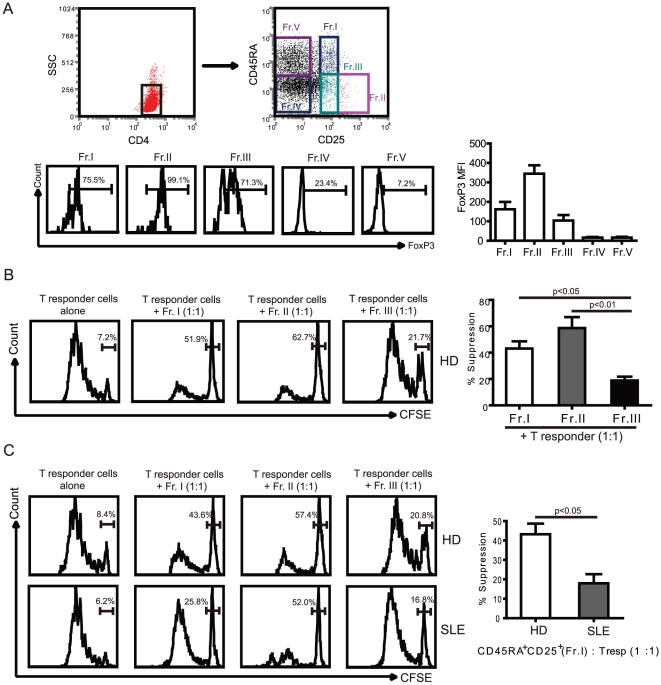
Figure 4. Functional characterization of the CD45RA/FoxP3-defined subset of T cells in SLE patients.
(A) Five subsets of CD4+ T cells were defined by the expression of CD45RA and CD25: CD25+CD45RA+ cells (Fr. I); CD25++CD45RA− cells (Fr. II); CD25+CD45RA− cells (Fr. III); CD25−CD45RA− cells (Fr. IV); and CD25−CD45RA+ cells (Fr. V). Expression of FoxP3 and MFI of FoxP3 were analyzed in CD25 and CD45RA defined T cell subsets. (B) CD4+CD25−CD45RA+ responder T cells were labelled with CFSE, and cultured at a 1∶1 ratio with unlabeled Fr.I, II, or III purified from healthy donor (n=3). Cell proliferation was assessed by CFSE dilution. The percent suppression is shown. Statistical analysis of the suppression percentage of T responder cells was performed by nonparametric Mann-Whitney U test. (C) Sorted CD4+CD25−CD45RA+ responder T cells were co-cultured with their autologous sorted Fr. I, II, or III, respectively, in order to assess the function of Fr. I/II/III cell suppression from healthy donors and active SLE patients. Representative FCM data are shown. Statistical analysis of the suppression percentage of T responder cells was performed from 5 healthy donors and 5 patients with active SLE.

