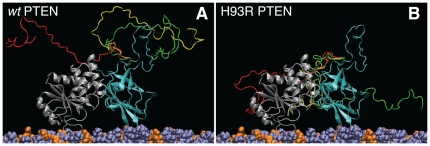
Figure 5. Schematic Depiction of the PTEN Phosphatase on the Surface of a Thermally Disordered stBLM.
Peptide backbone representation of (A) wt PTEN and (B) H93R PTEN positioned at a DOPC/DOPS (7∶3) membrane surface as deducted from the NR results. The membrane-associated protein penetrates the lipid headgroups (PC: violet, PS: orange) only barely. The PTEN core domains (PD: magenta, C2: grey) are shown in a conformation and membrane orientation deduced from the crystal structure [24]. The close correspondence, observed in Fig. 4, between the nSLD distribution across the interface determined in this work and the nSLD distribution of the truncated PTEN computed from the crystal structure suggests that this is a good approximation. Moreover, about 20% of the protein mass have been deleted in the truncated protein, and ∼20% of the nSLD remains unaccounted for in the overall nSLD distribution for wt PTEN in Fig. 4A, if we position the PTEN core domains at the membrane as shown here. The C-terminal tail, which forms the bulk of the deleted peptide, is apparently quite different in its organization in wt and H93R PTEN at the membrane. Shown here in red, yellow and green are three distinct conformations, obtained from Monte-Carlo simulations [57], on each PTEN protein core that are consistent with the observed nSLD distributions shown in Figs. 4A and C.

