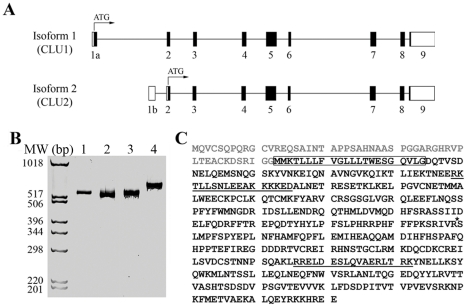
Figure 1. CLU1 and CLU2 are the primary CLU isoforms expressed in human brain.
The exon layout for the CLU1 and CLU2 isoforms is shown (A). Coding and non-coding exonic regions are represented by black and white boxes, respectively, while introns are shown as thin black lines. The first ATG site in each isoform is shown as well. Evaluation of CLU splicing by RT-PCR identified only CLU1 and CLU2 in human brain cDNA (B), i.e., single PCR products are observed upon amplification from exon 1a – exon 5 (lane 1), exon 1b – exon 5 (lane 2), exon 4 – exon 6 (lane 3) and exon 5 – exon 9 (lane 4). Molecular weight markers are shown at the left. The predicted protein sequences encoded by CLU1 and CLU2, beginning with the initial ATG sites shown in A, are shown in panel C. The sequence in gray font is unique to CLU1 while sequence in black font is common to CLU1 and CLU2. The boxed amino acid sequence represents signal sequence that is removed from clusterin-2 upon its translocation to the ER. Two nuclear localization sequences, as predicted by PSORT II (http://psort.ims.u-tokyo.ac.jp/form2.html), are underlined. The asterisk shows the clusterin cleavage site that separates the α- and β- subunits.

