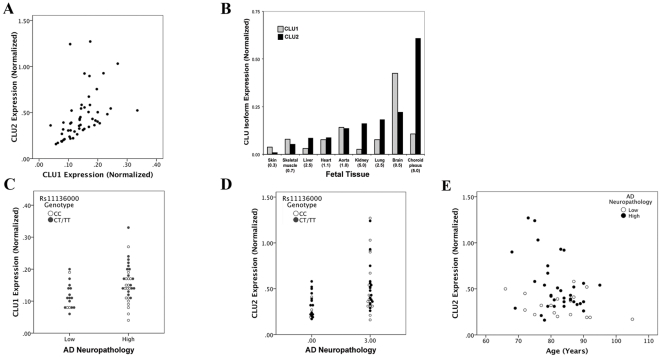
Figure 2. Expression of CLU isoforms in human tissues.
CLU1 and CLU2 isoforms were quantified by isoform-specific RT-PCR in a series of adult human cingulate and choroid plexus samples (A–B) as well as a human fetal tissues (B). Within A, each marker reflects the expression of CLU1 and CLU2, normalized to housekeeping genes, in a single brain sample. Within B, the value in parentheses following the tissue name is the CLU1∶CLU2 ratio. CLU1 expression shows a positive association with AD neuropathology and rs11136000T allele (C). CLU2 expression was increased in individuals with AD pathology and decreased with age (D–E).

