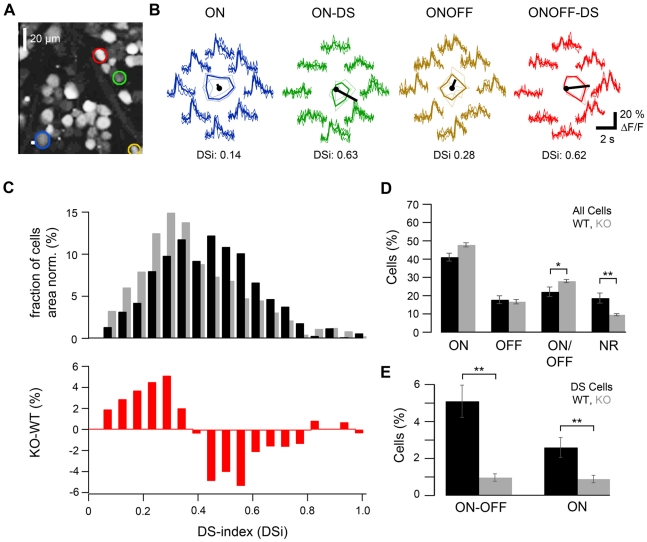
Figure 4. Analysis of DS responses in GABAAR α2 knock-out mice and wild-type animals.
A. Two-photon micrograph showing an optical section (110×110 µm2, at the level of the GCL) of mouse retina, with 56 ganglion cells (and displaced amacrine cells) stained by the calcium indicator dye OGB-1 via electroporation. B. Calcium responses (ΔF/F) evoked by a bar stimulus moving in 8 directions measured in four exemplary GCs (trace color matches color of ROIs [regions of interest] in A): an ON (blue), an ON-DS (green), an ON-OFF (yellow) and an ON-OFF-DS (red) ganglion cell. Polar plots of the response amplitudes, with the preferred direction (black line) indicated, are shown in the center of the traces and reflect the different DS tuning strength of the cells (see also direction selectivity index, DSi; for definition see Methods ). C. Histogram (top) showing the DSi distribution across all recorded GCL cells in GABAAR α2 knock-out mice (gray bars, n=2553 cells in 2 mice) and wild-type controls (black bars, n=1002 cells in 4 mice). Bottom: Difference between histograms (from top), illustrating the drop in the number of cells with higher DS-indices. D. Percentage of ON, OFF, ON-OFF, as well as non-responsive (NR) GCL cells in control (black bars) and knock-out animals (gray bars). E. ON-OFF and ON cells with a DSi>0.4 in the two groups of animals (cells were included or rejected after manual inspection of responses; see Results for complete criteria). (For E and D, relative cell type numbers were determined for each of the recorded GCL field –18 fields in wild-type, 30 in knock-out mice; with approx. 50–60 cells each– and then averaged; error bars indicate S.E.M.).

