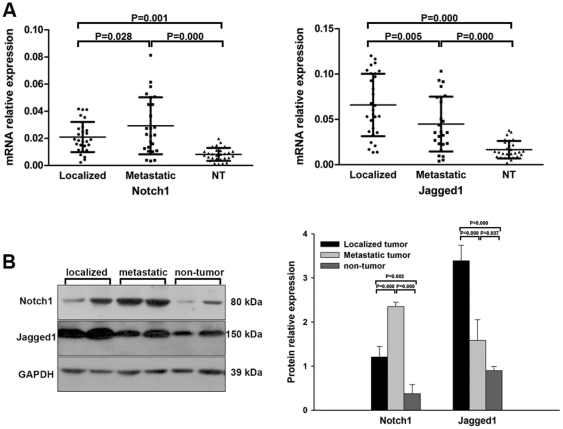
Figure 1. Notch1 and Jagged1 expression in ccRCC tissues.
(A) mRNA expression detected by real-time RT-PCR showing elevated Notch1 mRNA expression in localized and metastatic tumors compared to non-tumor(NT) tissues (P = 0.001 and P = 0.000 respectively), and higher expression in metastatic tumors compared to localized tumors (P = 0.028); On the right panel, analysis showing elevated Jagged1 mRNA expression in tumors compared to NT (P = 0.000 and P = 0.000 for localized and metastatic tumors respectively), but lower expression in metastatic tumors compared to localized tumors (P = 0.005). Each dot representing a tissue sample. (B) Protein expression detected by western-blot assay showing elevated expression of Notch1 and Jagged1 protein in tumor tissues compared to non-tumor tissues. The right panel was the densitometric analysis of the bands. The data shown are mean±SD.

