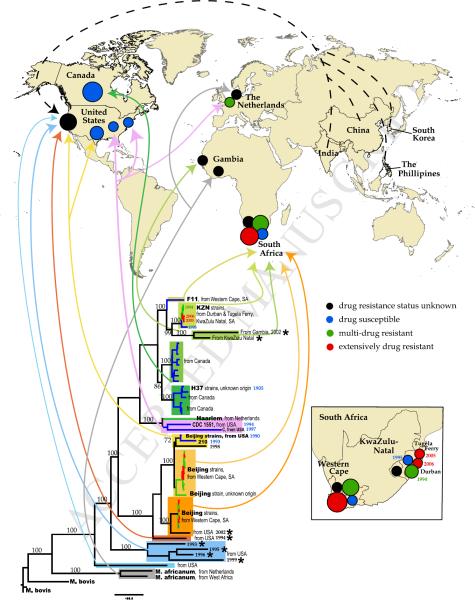
Figure 2. Phylogenetic lineages and geographic mapping.
Whenever available for the near full-length genomes, we recorded isolate's sample history: the year and geographic location of isolate collection, and patient history including place of birth and drug resistance status (Table 1). This allowed us to relate the isolates phylogeny with their geographic location and the date of sampling. Lower part of the figure: same phylogenetic tree that as shown in Figure 1A. The numbers on the brunches represent bootstrap values obtained using 200 bootstrap replicates. Sequence names are removed except several reference strains, but the most relevant information (genotypes, isolation place, year of sampling) is noted on the tree. As in Figure 1A, sequences that are highly enriched for clusters of potentially problematic bases (Table 1) are indicated with the stars. Each lineage is shown with a distinct background box color, which corresponds to the colors of Figure 1. The sub-lineages are shown with the shades of the same background box color. For example, the Beijing strain-related lineage is shown in shades of yellow and orange. Additionally, drug resistance status is indicated by branch color. 4 colors for branches are used: black – drug resistant status of the strain is unknown; blue -- drug susceptible (DS); green – mono-resistant to INH or multi-drug resistant (MDR); red – extensively drug resistant (XDR), or pre-XDR (resistant to either fluoroquinolones or aminoglycosides). Arrows that are the same color as the background boxes from which they originate show the geographic places of the sequence isolation on the world map at the upper portion of the figure. The black, blue, green and red circles on the map correspond to the drug status of the isolates, the same coloring scheme as in the tree. The relative size of the circles corresponds to the number of whole genomes isolated in the particular location. The dashed black arrows pointing to the black circle in California represent isolates that were sequenced in San Francisco from patients that were born in India, China, South Korea and The Phillipines. The more detail geographic distribution of whole genome isolates from South Africa is shown on insert at the right lower corner of the figure.

