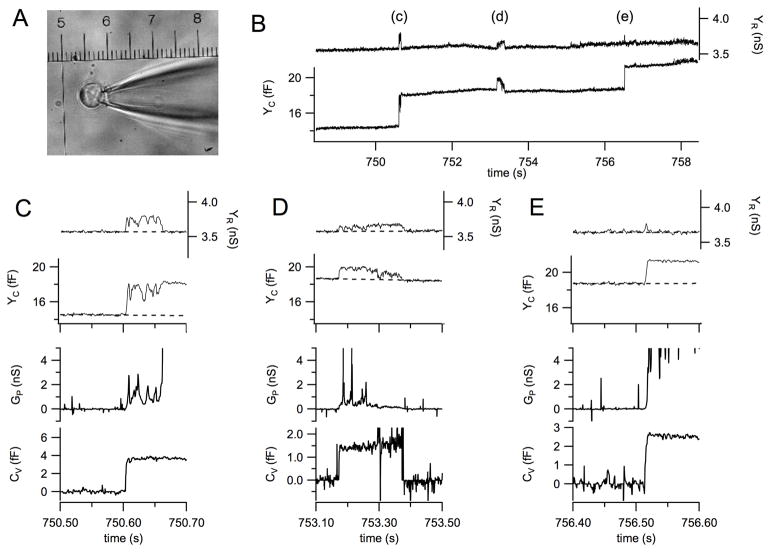
Fig. 4.
Example for a high resolution recording of exocytotic events from a bovine chromaffin cell. (A) The cell with sealed patch pipette in the cell attached configuration, the micrometer scale calibration is 25 μm for 1 unit. (B) Section of the recording from the cell shown in panel A reporting 3 subsequent exocytotic events labeled c–e. (C–E) The exocytotic events labeled c–e in panel B and their analysis on expanded time scales; traces from top to bottom are YR, YC, GP, and CV.

