
Figure 1. Defining the lupus case population: age adjusted carotid plaque area in lupus subjects compared to a vascular prevention clinic population.
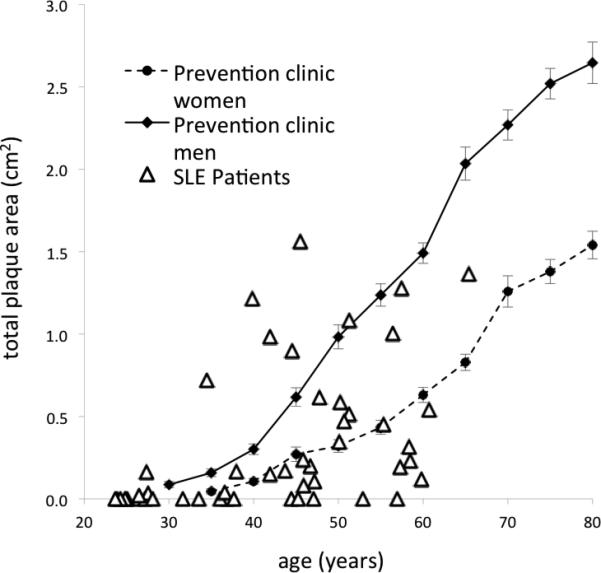
Pictured is the distribution of carotid total plaque area (TPA in cm2) by age in lupus patients (open triangles) compared to an historic population of stroke and hypertension prevention clinic patients (men - solid line, women - dashed line). TPA is presented on the y-axis, while age is represented on the x-axis. Note the lupus cases with TPA values above age-matched controls in the vascular prevention clinic.