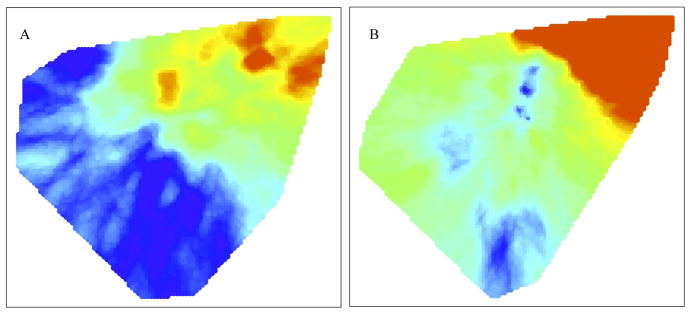
Figure 4.
Maps created from repeated applying the DBM algorithm to the data that was augmented by including samples of non-DST cases as MDR-positive cases based on the calculated inverse probability weights. (A) Map of the risk of a previously untreated TB case that received DST being positive for MDR, based on lab-confirmed MDRTB cases and IPW selected non-DST TB cases (F1), compared to all previously untreated TB cases (F0). (B) Map of the risk of a retreatment TB case that received DST (F1) being positive for MDR, based on lab-confirmed MDRTB cases and IPW selected non-DST TB cases, compared to all retreatment TB cases (F0).

