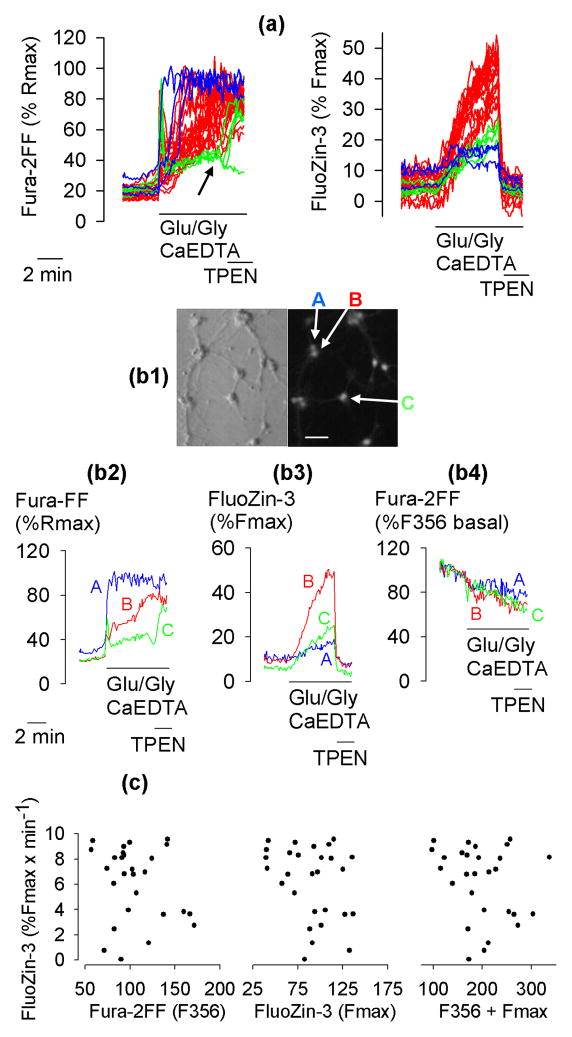
Figure 1.
The relationship between the rates of [Ca2+]i and [Zn2+]i increases. (a) Simultaneously monitored Fura-2FF and FluoZin-3 signals in 28 hippocampal neurons exposed to 100 μM glutamate and 10 μM glycine (Glu/Gly) under Na+-free conditions (Na+ was removed at the time Glu/Gly was added) with Na+ substituted with N-methyl-D-glucamine. Extracellular Zn2+ was chelated using 1 mM CaEDTA. Where indicated, 10 μM TPEN was added to chelate intracellular Zn2+. The colors, blue, red, and green, identify neurons with high, intermediate, and slow rates of Fura-2FF signal increase, respectively. (b1–b4) Data from three exemplar neurons A, B, and C from the population of 28 neurons shown in panel (a). (b1) A Hoffman modulation contrast image (left) and a FluoZin-3 Fmax image (right) of the neurons. Bar = 50 μm. (b2, b3) Fura-2FF and FluoZin-3 signals expressed as a percentage of Rmax and Fmax signal, respectively. The Rmax and Fmax signals were measured at the end of the experiment (not shown) as described in Methods. (b4) Fura-2FF F356 signal (isosbestic point) expressed as a percentage of F356 signal measured prior to Glu/Gly application. (c) The rate of FluoZin-3 signal increase does not correlate with the Fura-2FF isosbestic point (F356) fluorescence (left), the maximal FluoZin-3 signal (Fmax) (middle), or the sum of F356 and Fmax (right). The data in (a), (b1–b4) and (c) are from the same experiment, which was repeated 5 times with similar results.

