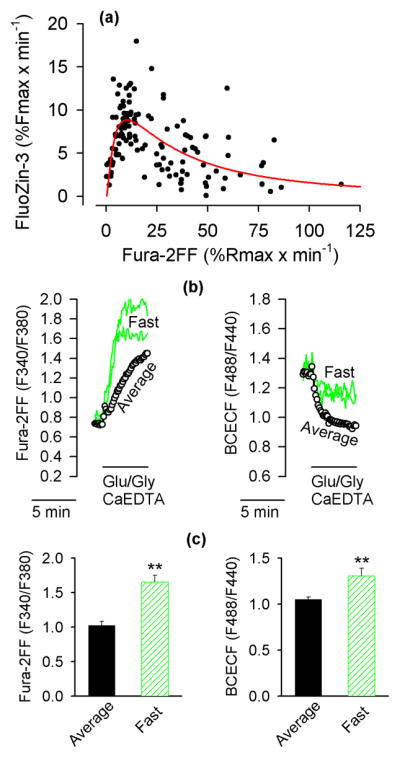
Figure 3.

The neurons with the fastest rates of [Ca2+]i increase acidify less and release less Zn2+ from intracellular stores. (a) The relationship between the rate of Fura-2FF signal increases and the rate FluoZin-3 signal increases. The data are from 128 individual neurons monitored in 6 experiments analogous to the one shown in Fig. 1a. The red line indicates the closest fit of the data to equation 4. Note that the rate on FluoZin-3 signal increase is positively correlated with the rate of Fura-2FF signal increase only up to about 10% of Rmax x min−1. At faster rates of Fura-2FF signal increases, the correlation becomes negative. (b) The neurons with the fastest rates of Fura-2FF signal increases acidify less than other neurons. Intracellular Fura-2FF and BCECF signals were simultaneously monitored in neurons exposed to Glu/Gly under the experimental conditions identical to those described in Fig. 1a. The neurons with the fastest rate of Fura-2FF signal increases were singled out (Fast; green traces); the data from all other neurons were averaged (Average, black open circles). Note that the neurons with the fastest rate of Fura-2FF signal increases (left panel) show a less pronounced drop in the BCECF signal (right panel). (c) Fura-2FF and BCECF signals measured 5 min after the onset of Glu/Gly application. The data are means ± SE from 4 experiments analogous to the one shown in (b). ** P < 0.01, Mann-Whitney Rank Sum Test.
