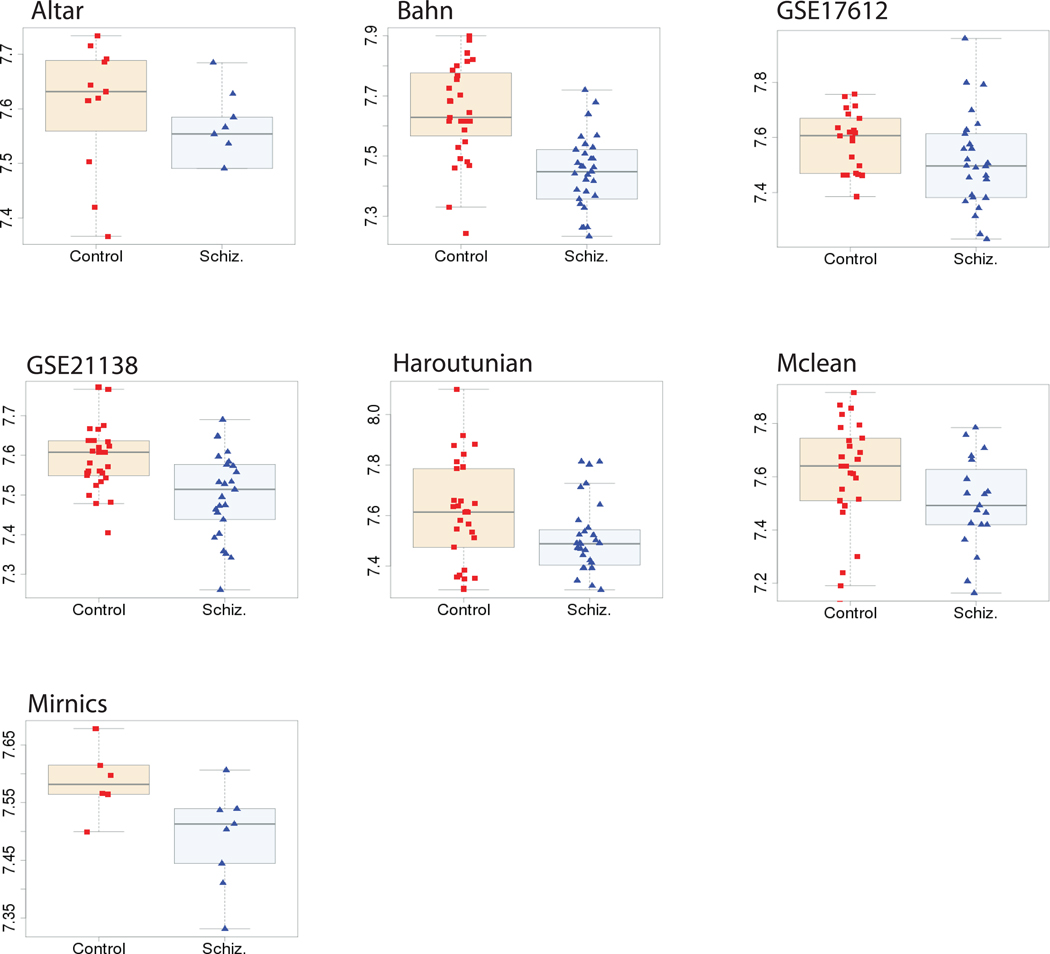
Figure 1. Example of consistent expression changes for a gene across data sets.
Expression data within each dataset after covariate correction is presented for the top down-regulated gene NECAB3. Plots are labelled with the associated dataset. Samples were separated into disease and control cohorts and expression was plotted as a boxplot. Individual sample values were overlaid on with red squares representing control individuals and blue triangles representing schizophrenics.

