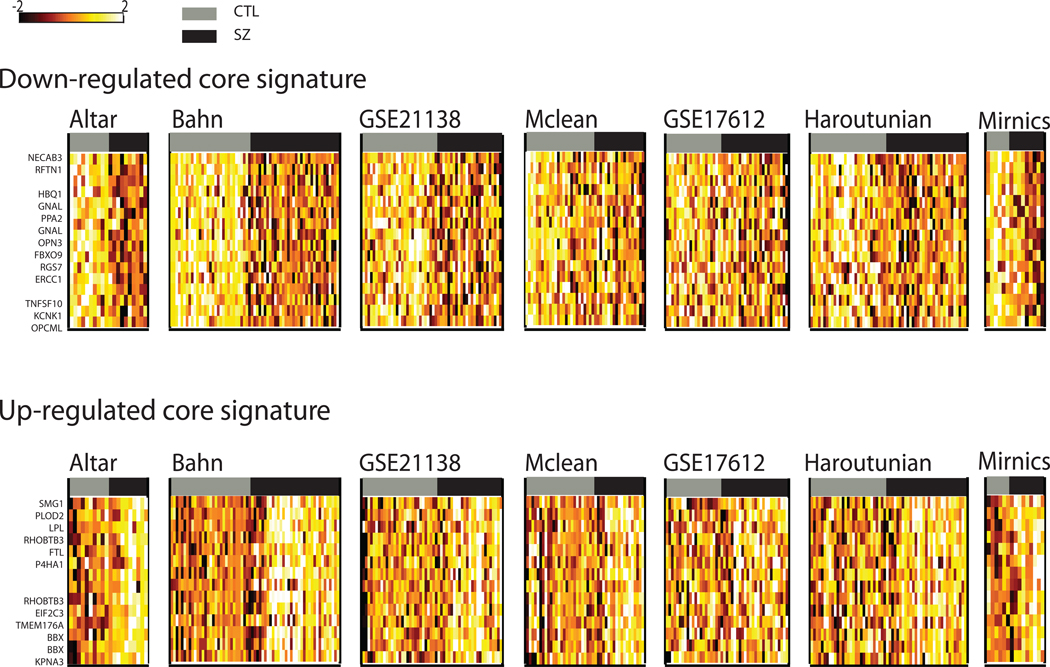
Figure 2. Expression changes in the ‘core signatures’.
For each probe in the core signatures (meaning they are retained as significant even after the removal of any single study), the corresponding data from each study was extracted and converted to a heat map. Expression values were normalized across all samples within each dataset, and as in Figure 1 the data are corrected for the covariates such as batch and age. Rows represent probes and are labeled with its unique gene mapping if one exists. Columns represent samples. Grey bars represent the control brain samples, and the black bar represents the schizophrenia samples. Light values in the heat map indicate higher expression values.

